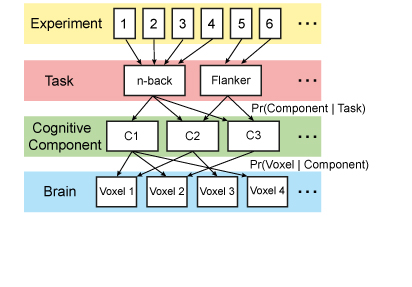
 The interactive image below allows you to investigate the probabilistic relationships among tasks, cognitive components, and brain regions. These relationships were estimated using a hierarchical Bayesian model. The model formalizes the intuition that performing a given task engages multiple cognitive components, which in turn recruit multiple brain areas (see Poldrack, 2006).
Slow connection? Download a zip file (30 MB) of this page and supporting images here.
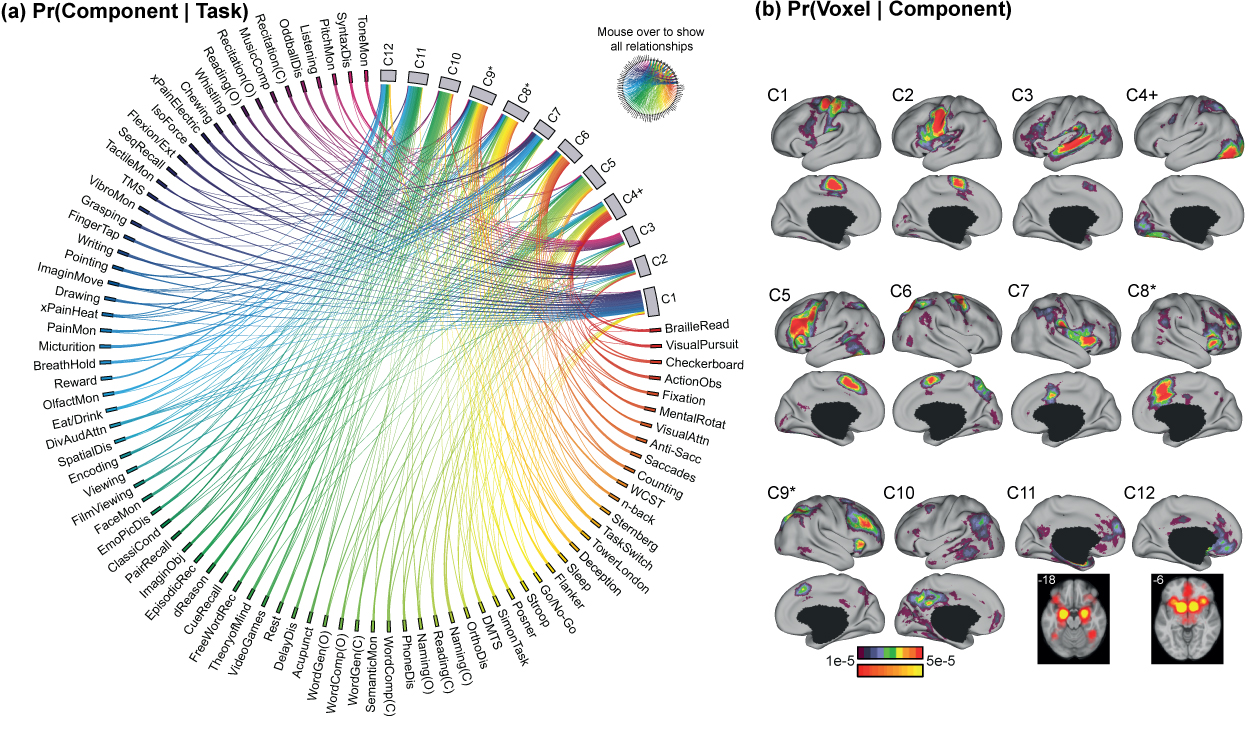
(Caption for figure above). 12-component model estimates. * indicates components that are unified in 11-component model; + indicates component that splits in 13-component model.
(a) Probability of tasks recruiting different components Pr(Component | Task). The components, C1 to C12, lie on the top right. The 83 tasks lie in the remaining segments of the circle. For the purpose of visualization, tasks with similar Pr(Component | Task) are more closely positioned and have similar associated colors. Each line connects one task with one component. The thickness of the lines is proportional to the magnitude of Pr(Component | Task), with the ends flared for easier visual comparison. Note that these probabalistic associations sum to 1 for each task.
(b) Probability of components activating different brain voxels Pr(Voxel | Component). The cerebral hemisphere with the stronger activation is shown, although most components have high probabilities of bilateral activation. An exception is component C5, which has high probability of activating the left, but not the right, hemisphere. Many components, especially C11 and C12, also activate subcortical regions. Note that these probabilistic associations sum to 1 for each component.